5 Ecommerce Sales Dashboard Examples to Watch
Level Up Today!
Book a DemoSee how an ecommerce sales dashboard can simplify your data. Explore five real examples that help online stores track sales, trends, and customer behavior.
Every day, your business tells you a story through its data. It tells you which products your customers love, which marketing campaigns are hitting the mark, and where you might be losing sales. The problem is, that story is often told in a dozen different languages across a dozen different platforms. An ecommerce sales dashboard acts as your universal translator. It gathers all those scattered data points and presents them in a single, coherent narrative with clear charts and graphs. This central hub turns a flood of raw numbers into actionable insights, empowering you to understand your business on a deeper level and make strategic choices that improve your bottom line.
Key Takeaways
- Centralize Your Data for a Clear Picture: A sales dashboard brings all your essential business metrics from different apps into one place. This gives you a single, reliable view of your performance, allowing you to stop switching between tabs and start making informed decisions quickly.
- Focus on Metrics That Actually Matter: Avoid the trap of tracking every number available. A powerful dashboard is one that highlights the key performance indicators (KPIs) most relevant to your goals, such as conversion rates, average order value, and customer lifetime value.
- Turn Insights into Actionable Growth: Use your dashboard to do more than just monitor sales. Analyze the data to understand customer behavior, identify your most profitable marketing channels, and manage inventory efficiently, turning everyday information into a clear strategy for growth.
What is an Ecommerce Sales Dashboard?
Think of an ecommerce sales dashboard as your online store's mission control. It's a single screen that pulls together all your most important performance data and presents it in a way you can actually understand—think clean charts, simple graphs, and key numbers at a glance. Instead of digging through endless spreadsheets or logging into five different apps, a dashboard gives you a clear, visual snapshot of your business's health. It automatically collects information from your sales channels, marketing platforms, and customer service tools, showing you exactly what's working and where you might need to make a change.
At its core, a dashboard answers your most pressing questions: How much did we sell today? Where are our customers coming from? Which products are the most popular? It's designed to turn a flood of raw data into actionable insights. A great dashboard doesn't just show you numbers; it tells you a story about your business. With the right analytics and reporting tools, you can stop guessing and start making strategic decisions based on real-time information. This central hub allows you to monitor performance, spot trends, and ultimately, find new ways to grow your revenue.
How Do Sales Dashboards Work?
A sales dashboard works by connecting to all the different software you use to run your business. It acts as a central hub, pulling data from your ecommerce platform, payment processor, email marketing service, and even your social media accounts. Once connected, it consolidates all this information into one unified view. This means you can track conversions, revenue, and other critical metrics without constantly switching between tabs.
The real magic is in how it helps you understand your customers and streamline your operations. By seeing which marketing campaigns are driving sales or which products are frequently purchased together, you can make smarter choices. This data can inform everything from your inventory orders to your next marketing automation sequence, making your entire business more efficient and responsive.
Why Your Online Store Needs One
Every online store generates a massive amount of data from sales, marketing efforts, and customer interactions. A sales dashboard helps you make sense of it all. Without one, you're essentially flying blind, relying on gut feelings rather than hard facts. Dashboards shine by translating complex data into clear, actionable insights that your whole team can use to make informed decisions.
This visibility is crucial for growth. When you can easily see what's happening in your business, you can react quickly to opportunities and challenges. For example, you might notice a sudden spike in traffic from a specific blog post and decide to put ad spend behind it. Or you could see that a discount code isn't performing well and adjust your strategy. It's all about using data to refine your approach to conversion and AOV optimization and build a more successful store.
Must-Have Features for Any Ecommerce Sales Dashboard
Not all sales dashboards are created equal. While most will show you basic sales numbers, the best ones offer a suite of features designed to give you a complete, actionable view of your business. When you're shopping around, think of it less as just a reporting tool and more as your business's command center. Look for a dashboard that doesn't just show you data but helps you understand it. Here are the non-negotiable features you should be looking for.
Real-Time Data and Seamless Integration
The world of ecommerce moves fast, and your data should, too. A top-tier dashboard provides real-time data, not information that's hours or even days old. This allows you to make informed decisions on the fly, whether you're managing inventory during a flash sale or adjusting an ad campaign that just launched. An effective dashboard centralizes this live data from all your sales channels, giving you a single, up-to-the-minute view of your business performance. Without it, you're always looking in the rearview mirror. Checkout Champ's analytics and reporting tools are built to give you this instant clarity.
Custom Reports and Metrics That Matter to You
Your business has unique goals, so why settle for a generic dashboard? The ability to customize your view is crucial. You should be able to choose which key performance indicators (KPIs) are front and center, whether it's customer lifetime value, conversion rates by traffic source, or average order value. A great dashboard lets you track the metrics that are most relevant to your specific business, collecting data on everything from sales and marketing to product performance. This tailored approach helps you focus on what truly drives growth instead of getting lost in vanity metrics.
Connections for Your Entire Tech Stack
Your ecommerce business is an ecosystem of different tools, and your dashboard needs to be the hub that connects them all. Look for a solution that integrates seamlessly with your entire tech stack—your ecommerce platform, email marketing software, fulfillment service, and customer support desk. This creates a single source of truth, eliminating the need to jump between different apps to piece together the full story. When your marketing automation and sales data live in the same place, you get a much clearer picture of your return on investment.
A Mobile-Friendly Design for On-the-Go Insights
As an entrepreneur, you're rarely tied to your desk. Your business doesn't stop when you step away from your computer, so your access to critical data shouldn't either. A must-have feature is a responsive, mobile-friendly design that works flawlessly on your phone and tablet. This ensures you can check on campaign performance, monitor sales, or address an issue from anywhere, at any time. Having powerful insights in your pocket means you can be proactive and stay in control, no matter where your day takes you.
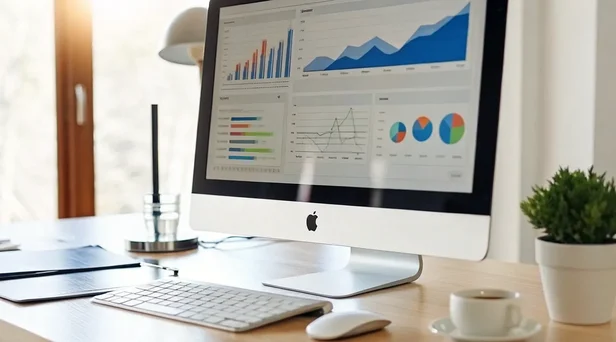
Clear Visuals and Easy-to-Read Charts
Data is useless if you can't understand it. The best dashboards transform raw numbers into clean, intuitive visuals like charts and graphs. This is about more than just aesthetics; good data visualization makes complex information digestible at a glance. It helps you quickly spot trends, identify outliers, and understand performance without needing to be a data analyst. By encouraging data-driven collaboration, a visually clear dashboard empowers your entire team to make smarter, faster decisions based on information that's easy for everyone to grasp.
What Key Metrics Should You Actually Track?
A sales dashboard can feel like a data firehose. With so many numbers to look at, it's easy to get lost in metrics that don't actually move the needle. The key is to focus on the key performance indicators (KPIs) that give you a clear, actionable picture of your business's health. An effective dashboard pulls real-time data from all your sources—sales, marketing, and customer interactions—and presents it with clear visuals. This helps you turn a flood of information into insights you can act on. Let's look at the core areas you should be monitoring.
Sales and Revenue Performance
This is the bottom line. Tracking your sales and revenue tells you if you're growing, stagnating, or shrinking. Go beyond just total revenue and monitor your Average Order Value (AOV) to see if customers are spending more per purchase. Also, keep an eye on your gross profit margin to ensure your sales are actually profitable. A good dashboard will break down sales by channel, helping you see where your most valuable customers are coming from. This data is the foundation for every strategic decision you make, from pricing to promotions and is a core part of any good conversion and AOV optimization strategy.
Customer Behavior and Lifetime Value (LTV)
Your business is built on customers, not just transactions. Understanding their behavior is essential for long-term growth. Key metrics here include Customer Lifetime Value (LTV), which tells you the total revenue a single customer is worth, and Customer Acquisition Cost (CAC), which shows how much you spend to get a new one. By tracking the entire customer journey, from their first visit to their final purchase, you can find ways to improve the shopping experience. This focus on behavior is crucial for building loyalty and increasing LTV, especially if you offer subscription billing.
Marketing ROI and Conversion Rates
Are your marketing dollars actually working? This is where you find out. Your dashboard should make it easy to measure the effectiveness of your marketing efforts. Track your overall conversion rate to see how many site visitors become customers. Dig deeper with metrics like cart abandonment rate to spot friction in your checkout process and Return on Ad Spend (ROAS) to see which campaigns are delivering real value. This data allows you to double down on what's working and cut what isn't, making your marketing automation efforts smarter and more efficient.
Inventory Levels and Product Performance
You can't sell what you don't have. At the same time, having too much cash tied up in slow-moving stock can sink a business. Your dashboard should give you a clear view of your inventory health. Track your best-selling products to ensure they're always in stock and identify which items aren't moving. Metrics like inventory turnover rate help you manage stock levels effectively. Proper product and SKU management prevents stockouts on popular items and keeps you from wasting money on products that aren't selling.
How a Sales Dashboard Can Change Your Business
If you've ever felt like you're drowning in spreadsheets and data from a dozen different apps, you're not alone. Running an ecommerce business means juggling information from your storefront, marketing channels, payment processors, and fulfillment partners. A sales dashboard cuts through that chaos by bringing all your most important metrics into one clean, visual space. It's your command center for everything happening in your business.
Instead of just collecting data, a great dashboard helps you understand it. It turns complicated business numbers into clear ideas so you can make smart choices. With a centralized view of your operations, you can stop reacting to problems and start proactively building your business. The right analytics and reporting tool doesn't just show you what happened yesterday; it gives you the insights you need to shape what happens tomorrow. From spotting new trends to refining your marketing spend, a dashboard is the key to making confident, data-backed decisions that drive real growth.
Make Smarter Decisions, Faster
In ecommerce, speed matters. A sales dashboard gives you access to real-time data, so you can stop waiting for weekly reports to tell you what's going on. You can see how a new ad campaign is performing within hours, not days, and adjust your strategy on the fly. If a product suddenly starts selling out, you'll know instantly and can reorder before you lose potential sales.
This is what it means to be agile. Ecommerce dashboards help you keep track of how well you are doing so you can make better decisions to improve sales and operations. Imagine noticing a sudden dip in your conversion rate. With a dashboard, you can quickly investigate whether it's a technical glitch on your site, a broken link in an email, or an issue with a payment gateway, and fix it before it seriously impacts your revenue.
Improve Your Customer Experience
Your sales dashboard is more than just a collection of numbers—it's a window into your customers' minds. By tracking metrics like cart abandonment rates, average order value, and customer lifetime value, you get a clear picture of their behavior. You can see which products they love, where they drop off in the buying process, and what makes them come back for more.
This information is gold. An effective dashboard centralizes real-time data from multiple sources, using clear visuals to help you make sense of it all. You can use these insights to create a better shopping experience, from personalizing marketing campaigns to optimizing your checkout flow. When you truly understand your customers, you can give them exactly what they want, building loyalty that lasts.
Simplify How You Manage Multiple Stores
Juggling more than one online store can feel like a logistical nightmare. Logging into separate platforms to check sales, manage inventory, and pull reports is time-consuming and makes it difficult to see the big picture. A unified sales dashboard solves this by consolidating data from all your sales channels into a single, easy-to-read interface.
With everything in one place, you can instantly compare the performance of different stores, identify which products are selling best on each platform, and manage your inventory more efficiently. This is especially powerful for businesses that sell on their own website, through marketplaces, and on social media. A platform with strong multi-store management capabilities gives you a holistic view, saving you time and helping you allocate resources where they'll have the biggest impact.
Forecast Future Sales and Trends
A sales dashboard doesn't just tell you about your past performance; it helps you predict the future. By analyzing historical sales data, you can identify seasonal patterns, spot emerging trends, and forecast demand with greater accuracy. This allows you to make proactive decisions about inventory, marketing, and staffing, ensuring you're always one step ahead.
For example, if your dashboard shows a consistent sales spike for a certain product every fall, you can plan your inventory and marketing campaigns well in advance to capitalize on that trend. This kind of ecommerce forecasting moves you from a reactive position to a strategic one. You'll be better prepared for busy seasons, avoid stockouts on popular items, and launch new products with confidence, knowing you're backed by data.
Comparing the Top Ecommerce Sales Dashboards
Once you know what you're looking for, it's time to see what's out there. The market is full of great options, from platform-native tools to powerful third-party apps. The best choice for you really depends on your current tech stack, your budget, and how deep you want to go with your data. Let's walk through some of the most popular choices so you can see how they stack up.
Checkout Champ Analytics & Reporting
If you're looking for an all-in-one platform that brings every piece of your business data together, Checkout Champ is built for that. The comprehensive analytics dashboard gives you a complete picture of your store's health, from sales performance and conversion rates to customer behavior. It's designed to give you actionable insights right away, helping you spot things like high cart abandonment rates so you can fix leaks in your checkout process. Because it's integrated with your payments, marketing, and fulfillment, you get a single source of truth without having to piece together data from different apps.
Shopify's Native Analytics
For businesses running on Shopify, the built-in analytics dashboard is a natural starting point. It's designed specifically for Shopify store owners and does a great job of covering the essentials. You can easily track key metrics like total sales, average order value (AOV), and customer acquisition costs right out of the box. This allows you to quickly check your store's performance and make informed decisions without needing a separate tool. While it's incredibly convenient, you might find you need more advanced reporting or cross-channel insights as your business grows and your marketing efforts expand.
Google Analytics and Data Studio
For the data-obsessed, combining Google Analytics with Data Studio offers nearly limitless possibilities. This duo is a powerhouse for creating highly customized dashboards that visualize exactly what you want to see. You can pull in data from your online store to track traffic sources, map out user journeys, and monitor conversion funnels in granular detail. It's an incredibly flexible and powerful solution, but it comes with a steeper learning curve. You'll need to be comfortable setting up tracking and designing your own reports, which can be time-consuming compared to an out-of-the-box solution.
WooCommerce Analytics
If your store is built on WordPress, WooCommerce provides its own built-in analytics to help you get started. The dashboard gives you a solid overview of your sales, revenue, and customer data without ever leaving your WordPress admin panel. You can get quick insights into which products are your bestsellers and understand general customer behavior, making it easier to optimize your store. It's a fantastic tool for managing a single WooCommerce store, but like other native options, you may eventually need a more robust platform to handle multi-store management or more complex reporting needs.
Other Third-Party Dashboard Tools
Beyond platform-specific tools, there are dedicated third-party dashboard apps like DataBox and Geckoboard that specialize in data integration. These tools are great if you need to pull metrics from many different sources—like your ecommerce platform, email marketing software, and social media accounts—into one centralized view. They help you track everything from sales and marketing effectiveness to customer engagement in real-time. The main trade-off is that this adds another subscription and another piece of software to your tech stack that you'll need to manage and integrate.
How to Choose the Right Sales Dashboard for Your Store
Picking a sales dashboard feels like a huge decision, but it doesn't have to be overwhelming. The goal is to find a tool that gives you clear, actionable insights without adding more complexity to your day. Think of it as hiring a data analyst who works 24/7 to show you exactly what's happening in your business. When you're comparing options, it's not just about the flashy charts and graphs. You need a dashboard that fits into your existing workflow, grows with you, and gives you real value for your investment. To find the right fit, focus on a few key questions that cut through the marketing noise and get to the heart of what your store truly needs.
Does It Work With Your Current Tools?
Your sales dashboard should be the central hub for your data, not another isolated island. Before you commit, make sure it can seamlessly connect with the tools you already use every day. This includes your ecommerce platform (like Shopify or WooCommerce), your email marketing software, your ad platforms, and your fulfillment services. A dashboard that requires you to manually export and import data constantly will just create more work. Look for a platform with robust, pre-built integrations that pull all your information together automatically. This gives you a complete, accurate picture of your business without the headache of manual data entry.
Can It Grow With Your Business?
The dashboard that works for you today should also work for you in two, or even five, years. As your business expands, your needs will change. You might add new product lines, start selling in different countries, or even launch a second store. Can your dashboard handle that growth? Consider its ability to manage data from multiple stores, process higher order volumes, and track an increasing number of SKUs. Choosing a scalable solution from the start saves you from a painful migration process down the road. Think long-term and pick a partner that's ready to grow alongside you.
Is Your Data Safe and Secure?
You're not just handling sales numbers; you're responsible for sensitive customer information. Data security is non-negotiable. A reputable dashboard provider will have strong security measures in place to protect your data and your customers' privacy. Look for information on their security protocols, data encryption, and compliance with regulations like GDPR and CCPA. Dashboards handle private customer information, so they need to be very secure. Don't be afraid to ask direct questions about how they safeguard data. Your customers' trust is one of your most valuable assets, so make sure any tool you use helps you protect it.
How Easy Is It to Use?
A powerful dashboard is useless if you can't figure out how to use it. The best tools present complex data in a simple, intuitive way. You shouldn't need a degree in data science to understand your own sales trends. Look for a clean interface, clear visuals, and the ability to customize what you see. Can you easily create the reports you need? Can you quickly find the metrics that matter most? A great dashboard helps you make smarter, faster decisions because the information is easy to digest. If you're considering a platform, ask for a demo to see its analytics and reporting in action.
Understanding the Price and Value
Finally, let's talk about cost. While it's tempting to just compare monthly fees, it's more important to consider the overall value. A cheaper tool that wastes your time or provides limited insights isn't a bargain. Instead, think about the return on your investment. Will this dashboard help you identify opportunities to increase your average order value? Will it save your team hours of manual reporting each week? A good tool can save you a lot of time and money in the long run. Also, consider platforms that bundle analytics with other essential features. An all-in-one solution often provides far more value than a standalone dashboard.
Can You Try Before You Buy? (Free Trials & Demos)
Committing to a new software tool for your business is a big decision, and a sales dashboard is no exception. You wouldn't buy a car without a test drive, and the same logic applies here. Before you invest your time and money, you need to know if a platform is the right fit for your team and your goals. The good news is that many providers offer ways to get a feel for their software before you sign a contract.
Exploring free trials and demos is the best way to see a dashboard in action with your own data. It helps you move past the marketing promises and see how the tool actually performs. This is your chance to check for a user-friendly interface, test the integration process, and confirm that the reports are genuinely useful for your business. Taking the time to properly evaluate your options will save you from a headache down the road and ensure you choose a tool that truly supports your growth.
Finding Free Trials and Demos
Most dashboard providers know you want to try their product first, so they often offer a free trial or a personalized demo. A free trial gives you hands-on access to the platform for a limited time, letting you connect your data sources and explore the features on your own. Some tools even provide free sales reporting templates to help you visualize your data quickly. A demo, on the other hand, is a guided tour with a sales representative who can answer your specific questions and show you how the tool can solve your unique challenges. With a platform like Checkout Champ, you can request a demo to see how an all-in-one solution brings all your analytics together in one place.
A Look at Pricing and Potential Discounts
Sales dashboard pricing can vary quite a bit, from affordable monthly plans to enterprise-level contracts that cost thousands per month. Some high-end analytics platforms don't offer a free trial and can be a significant investment from day one. When you're comparing options, look beyond the monthly fee. Consider what's included in each tier. Does it cover all the integrations you need? Is customer support included? An all-in-one platform often provides more value by bundling analytics and reporting with other essential e-commerce tools, which can be more cost-effective than paying for multiple separate services. Don't hesitate to ask about discounts for annual payments, as this can often save you money.
What Are Other Users Saying?
Before making a final decision, see what other e-commerce owners think. Customer reviews on sites like G2, Capterra, and the Shopify App Store are a great source of honest feedback. Look for comments that mention ease of use, the quality of customer support, and data accuracy. Other users can highlight benefits you hadn't considered, like how a dashboard helped them make sense of massive amounts of sales data or use customer review analysis to improve retention. Pay attention to both positive and negative reviews to get a balanced view. This firsthand insight can be incredibly valuable in confirming whether a dashboard will really work for a business like yours.
Getting Started: How to Set Up Your Sales Dashboard
Ready to build a dashboard that actually works for you? It's easier than you might think. The key is to approach it methodically instead of just jumping in and clicking around. A little planning goes a long way in creating a central hub that gives you clear, actionable insights instead of a jumble of confusing charts.
Think of it as designing your command center. You want every piece of information to have a purpose and be exactly where you need it. By following these three simple steps, you can set up a powerful sales dashboard that helps you understand your business on a deeper level and make smarter decisions every single day. Let's get started.
Step 1: Plan Your Dashboard Layout
Before you connect any data, take a moment to think about what you truly need to see. A well-designed e-commerce dashboard will help you better understand your customers while streamlining your operations. The goal isn't to track every metric possible, but to focus on the ones that matter most to your business. Ask yourself: What are the top five numbers I need to know to feel confident about my store's health? This could include sales performance, customer acquisition costs, and conversion rates. Sketch out a rough layout on paper or a whiteboard. This simple exercise helps you prioritize your key performance indicators (KPIs) and ensures your final dashboard is clean, focused, and genuinely useful.
Step 2: Connect and Test Your Data Sources
Your dashboard is only as powerful as the data flowing into it. Connecting your dashboard to real-time data sources is crucial for getting an accurate picture of your business. This means integrating data from your e-commerce platform, social media channels, email marketing software, and any other tools you use. Platforms with built-in analytics and reporting can simplify this, as much of your core data is already in one place. Once you've connected everything, don't forget to test it. Run a few reports and compare the numbers to what you see in the source platforms. This ensures your connections are solid and the data you're relying on is completely accurate.
Step 3: Get Your Team On Board
A sales dashboard shouldn't be a secret tool used by only one person. Encouraging data-driven collaboration is essential for growth. Get your team involved in the setup process from the very beginning. Ask your marketing manager what campaign metrics they need to see, or check with your customer service lead about which support stats would be most helpful. When everyone has a hand in building the dashboard, they're more likely to use it. This approach ensures everyone has the visibility they need to make informed decisions in their roles, creating a data-driven culture where the entire team is aligned and working toward the same goals.
Common Roadblocks (and How to Avoid Them)
Setting up a new sales dashboard is exciting, but let's be real—it's not always a perfectly smooth ride. Like any powerful tool, there are a few common hurdles you might encounter along the way. The good news is that with a little foresight, you can sidestep them completely. Think of this as your friendly heads-up so you can get straight to the good stuff: growing your business.
Ensuring Your Data is Accurate
A dashboard is only as smart as the data you feed it. If you're pulling messy or incomplete information from different sources, the charts and graphs you see won't give you the real story. For your dashboard to be truly useful, the data going into it needs to be accurate and organized. The best practice is to gather information from all your sales and marketing tools into one central place. This is much easier when you use an integrated platform where your marketing automation and sales data live together, ensuring you're always looking at a complete and reliable picture.
Keeping Your Customer Data Private
Your sales dashboard will handle a lot of sensitive customer information, from purchase history to contact details. Protecting this data isn't just a technical requirement; it's fundamental to earning and keeping your customers' trust. Security can't be an afterthought. When you're choosing a dashboard solution, make sure it has robust security measures in place. A reputable provider will be transparent about how they protect your data, giving you peace of mind that your business and your customers are in safe hands.
How to Avoid Drowning in Data
When you first log into a comprehensive dashboard, it can feel like you're staring at a wall of numbers. It's easy to get overwhelmed by the sheer volume of information available. The key is to remember that a good dashboard is designed to turn all that data into clear, useful insights. Instead of trying to track every single metric, start by focusing on the handful that matter most to your specific goals. A well-designed analytics and reporting tool will help you cut through the noise and focus on what's actually driving your business forward.
Factoring in Cost and Setup Time
You generally have two options when it comes to a sales dashboard: build your own or buy a ready-made solution. Building a custom dashboard gives you complete control, but it's a major undertaking. You're looking at a timeline of 3–6 months, a team of engineers, and a significant financial investment. On the other hand, choosing a pre-built tool is much faster—you can be up and running in a matter of days. It also requires far less technical help and comes with a clear, predictable monthly cost, making it a more practical choice for most ecommerce businesses.
Related Articles
- The Role of Data-Driven Insights in Enhancing eCommerce Profitability
- What Metrics Are Important for an eCommerce Management Dashboard?
- Analytics Reporting
- What Tracking Do You Need Beyond Google Analytics?
- How to Leverage a CRM for Ecommerce: Organize, Manage, and Scale with Confidence
Frequently Asked Questions
My business is still small. Is a sales dashboard overkill?
Not at all. In fact, this is the perfect time to get one. Using a dashboard early on helps you build good data habits from day one, so you can make smart, informed decisions as you scale. It's much easier to set up a strong foundation now than to try and sort through messy data when your business is five times bigger.
Can't I just use spreadsheets to track my sales?
You could, but the time you spend manually updating spreadsheets is time you aren't spending on growing your business. A sales dashboard automates this process by pulling in live data from all your tools. This not only saves you hours of work but also eliminates the human error that comes with manual data entry, giving you a truly accurate picture of your performance.
What's the difference between a dashboard and just using Google Analytics?
Google Analytics is a powerful tool for understanding your website traffic and how users behave on your site. A dedicated ecommerce dashboard, however, gives you the full story. It connects your website data with information from your payment processor, marketing platforms, and fulfillment software to show you the complete financial health of your business, including profit margins and customer lifetime value.
I'm not a data expert. Will I be able to understand everything?
Absolutely. A well-designed dashboard is meant to make data simple. It translates complex numbers into clean charts and visuals that are easy to understand at a glance. The goal isn't to turn you into a data scientist; it's to give you clear, actionable insights so you can confidently make decisions for your store.
How do I know which metrics are the most important to track first?
It's easy to feel overwhelmed, so start with the basics. Focus on three key areas: how you make money, how you find customers, and how happy they are. To start, track your Total Revenue, Customer Acquisition Cost (CAC), and Customer Lifetime Value (LTV). Mastering these three metrics will give you a solid snapshot of your business's health before you dive into more granular data.